ElasticSearch
ELK准备
添加源
具体可以参考https://www.elastic.co/guide/en/logstash/7.16/installing-logstash.html#_yum
debian系
|
|
centos系
|
|
Logstash
安装
debian系
|
|
centos系
|
|
ElasticSearch
介绍
参考https://www.elastic.co/guide/cn/elasticsearch/guide/current/getting-started.html
elasticsearch是一个基于lucene库的实时的分布式搜索分析引擎,主要用作全文检索,结构化搜索,分析以及这三种的组合
常见的应用场景有系统日志分析、应用数据分析、安全审计、关键词搜索等
es是面向文档的,对于复杂关系,比如地理信息日期等对象都可以保存,这是相比较于关系型数据库优势的地方
安装
|
|
启动
|
|
可能报错:
启动报错了 failed; error='Not enough space' (errno=12) 修改下es的启动参数
|
|
生产jvm参数参考
|
|
测试
|
|
代表es数据成功写入
集群搭建
参考集群搭建,
三台服务器
RESTful API with JSON over http
通过9200交互
liuliancao@liuliancao-dev:~/projects/lion$ sudo lsof -i:9200 COMMAND PID USER FD TYPE DEVICE SIZE/OFF NODE NAME java 50762 elasticsearch 284u IPv6 141518 0t0 TCP localhost:9200 (LISTEN) java 50762 elasticsearch 285u IPv6 141519 0t0 TCP localhost:9200 (LISTEN)
Curl, Groovy, Javascript, .NET, PHP, Perl, Python, Ruby (https://www.elastic.co/guide/en/elasticsearch/client/index.html)
Curl
curl -X<VERB> '<PROTOCOL>://<HOST>:<PORT>/<PATH>?<QUERY_STRING>' -d '<BODY>'
查询集群中文档数量
curl -XGET 'http://localhost:9200/_count?pretty' -d ' { "query": { "match_all": {} } } ' 实际执行结果是 liuliancao@liuliancao-dev:~/projects/lion$ curl -XGET 'http://localhost:9200/_count?pretty' -d ' { "query": { "match_all": {} } } ' { "error" : "Content-Type header [application/x-www-form-urlencoded] is not supported", "status" : 406 } ..., 需要调整下header, 这个结果代表我们没有分片和文档存在 liuliancao@liuliancao-dev:~/projects/lion$ curl -XGET -H 'Content-Type: application/json' 'http://localhost:9200/_count?pretty' -d ' { "query": { "match_all": {} } } ' { "count" : 0, "_shards" : { "total" : 0, "successful" : 0, "skipped" : 0, "failed" : 0 } }
JSON形式保存对象
一些es中的概念
索引
类型
属性
集群状态查看
|
|
列出所有index
|
|
模糊删除index
|
|
当然习惯界面的话,在kibana索引管理,里面也可以删除
index的number_of_replicas number_of_shards设置
最近发现系统的shards满了,所以和同事一起看下了参数,发现对于index的参 数设置,分为动态和静态参数 https://www.elastic.co/guide/en/elasticsearch/reference/6.5/index-modules.html#_static_index_settings
https://www.elastic.co/guide/en/elasticsearch/reference/6.5/index-modules.html#dynamic-index-settings
首先前提是logstash-开头是我的索引,如果你没有对应的template,则需要创建 我主要想降低下number_of_shards和number_of_replicas
对于number_of_shards你是无法直接PUT /索引名字 修改settings的,只能关联 template来影响后续的index, 如果需要操作老的,则需要进行reindex操作
修改template
|
|
执行reindex样例和创建别名
|
|
后来发现集群还是red,检查unassighed shards发现还有,删除掉red的index,恢 复
|
|
发现提示是有问题的
https://www.elastic.co/guide/en/elasticsearch/reference/current/cluster-allocation-explain.html 基本是这几种错误
DSL
Query查询
一个典型的查询 https://www.elastic.co/guide/en/elasticsearch/reference/current/query-filter-context.html
|
|
指定正则匹配
https://www.elastic.co/guide/en/elasticsearch/reference/current/query-dsl-regexp-query.html
|
|
聚合查询
聚合里面进行count排序
|
|
kibana
测试使用
浏览器访问服务器地址:5601端口 建议通过nginx+ssl配置,会比较安全
FAQ
es报错 kibana无法启动
shard has exceeded the maximum number of retries [5] on failed allocation attempts - manually call [/_cluster/reroute?retry_failed=true] to retry, [unassigned_inforeason=ALLOCATION_FAILED], at[2024-03-24T12:14:02.651Z], failed_attempts[5], failed_nodes[[joxyW01nTNCGvFW1IjPQMQ, JaEcQBEZTOiztZdlj-iZBw, delayed=false, details[failed shard on node [JaEcQBEZTOiztZdlj-iZBw]: failed recovery, failure RecoveryFailedExceptionlogstash-overseas-ssjj2-hall-server_accesslog-2024.03; nested: CircuitBreakingExceptionparent] Data too large, data for [internal:index/shard/recovery/start_recovery] would be [4212820374/3.9gb], which is larger than the limit of [4080218931/3.7gb], real usage: [4212805912/3.9gb], new bytes reserved: [14462/14.1kb], usages [request=0/0b, fielddata=259024/252.9kb, in_flight_requests=23636/23kb, model_inference=0/0b, eql_sequence=0/0b, accounting=449937262/429mb; ], allocation_status[no_attempt]]]
结果是kibana一直挂,es状态异常,active到不了100%
解决 elasticsearch.yml
|
|
增加这个以后集群状态变成green了
Elasticsearch in action
elasticsearch6.8导入书里面的数据
这本书的版本比较老,有很多不兼容的地方,这里我进行了6.8的简单适配
你可以参考 https://github.com/liuliancao/elasticsearch-in-action/tree/6.8 我这个 进行导入
导入方法就是把这个脚本放到服务器上面,执行下就好了,我没有用
mapping.json,让es自动生成了,另外由于新版本es不支持多个type,所以索引
变成
get-together-event
get-together-group
对应书里面的get-together/event 和get-together/group
对于parent关系啥的,这里我先舍弃了,需要学习的时候看下官方的例子好了, 主要是理解有这个概念然后进行适当延伸
Chapter2
insert data p26
|
|
create an index
|
|
get index mapping
|
|
insert data by script ( pay attention to your version 6.x or 7.x change to it)
|
|
get all data
|
|
search by data (uri search)
|
|
json query (request body search)
json的广义搜索,创建一个query,查询字符串是EC2和上面的
INDEX/_search?q=EC2 一样
|
|
query like kibana
这里具体就是lucene字符串了
|
|
query with term
term是术语或者关键词的意思,所以这里表示你就是想搜某个字段匹配,这里我 怎么也查不出来数据,可能我的数据和书里面的不太一样,并且都是自动分词的, 如果你是keyword类型应该是可以的。一般name,id等唯一性字段建议设置成 keyword类型,这样term查询的时候还有不分词的时候性能也会好点。
这个是老的index,都是text啥的类型,没有keyword类型
|
|
先自己创建一个index,并且插入三条数据
|
|
这个时候我们执行下查询
|
|
query with aggregations term
基于上面创建的index, 进行聚合,聚合字段为name,使用terms方式,这个聚合的名字叫xingshi_daquan
|
|
可以发现
Chapter3
add index mapping and change it
创建一个新索引字段mapping,但是尝试继续修改的是报错了,提示已经有了
我的系统版本是6.8 可以参考 https://www.elastic.co/guide/en/elasticsearch/reference/7.8/mapping.html
|
|
注意这里_doc只是一个名字,你也可以起成其他的名字, 比如
|
|
所以上面报错的测试可以这样curl
|
|
当你尝试修改已经存在的字段的时候就会报错,这个时候估计只能reindex才能 解决了
|
|
但是我们可以添加字字段
|
|
所以es的各个版本的API存在变化,大家要多尝试尝试,有的时候确实挺难受的
get specific fields
如果只想获取指定的字段,原书中的fields=已经不用了,可以用_source或者 stored_fields(依赖设置)来获取
|
|
另一个办法是stored_fields方式,但是我们目前无法修改成stored_fields,所 以执行个reindex
|
|
再试下stored_fields
|
|
一般使用stored_fields表示不全部把_source获取过来,优点是可以减少数据传输,提高性 能和避免暴露信息
update doc from id
关于6.8的更新具体请看文档https://www.elastic.co/guide/en/elasticsearch/reference/6.8/docs-update.html 如果是新版把6.8换成对应版本或者current
更新doc内容: 使用POST INDEX_NAME/_doc/DOC_ID/_update -d '{"doc":{}}'
使用script更新 POST INDEX_NAME/_doc/DOC_ID/_update -d '{"script":{}}'
参考官方例子, 你可以在脚本里面使用变量,可以进行计算后赋值
|
|
|
|
delete doc
删除就很明确了,不过要注意删除了就恢复不了,除非你创建快照等信息,所以 此操作一定要谨慎 DELETE /INDEX_NAME/DOC_ID
|
|
close or open index
通常当一个索引我们暂时不想删除,后面可能会用,但是目前不用,我们又不想 浪费服务本身的性能,这个时候可以先执行close,这样在内存里面就只会有一些 元数据了
|
|
Chapter4 Searching your data
search url
关于搜索dsl, 你可以使用rest api,关键词是 _search
可以整个集群搜,也可以指定index进行搜索,另外可以使用*进行blob匹配
|
|
关于一个搜索,你可能需要注意你的查询条件(query),查询希望返回的条目数目(size),翻页 的开始(from),是否返回所有的字段(_resource),和希望的排序方式(sort)
比较常见的有(摘自书里面),内容比较长我就不写出来了
|
|
search url with request body
通过带上各种参数,我们可以实现更强大的搜索功能
上面我们的uri参数也能放进去, 其中query match_all那个也可以省略
|
|
在指定_source的时候我们可以使用include和exclude
|
|
甚至你可以交叉取差集
首先看一个简单的query
|
|
这里书里面强调filter和query不同,filter不会计算score的数值,所以filter 会比score要快一点,并且由于filter的时候会对比bit位,如果满足才是1,这个 搜索也是会缓存的,但是由于版本迭代书里面的query已经失效了,现在可以参 考https://www.elastic.co/guide/en/elasticsearch/reference/current/query-dsl-bool-query.html
这里发现分为几个关键词
must 相当于之前的query了,会计算score
filter 不会计算score
must_not score为0 不包含
should 可以包含,包含以后score会更高,不包含也会被返回
|
|
search queries
match_all
match_all 表示返回所有的数据,是最简单的查询
|
|
filter query
接着我们用上面说的filter query方式,获取name必须是ysg的结果
|
|
query_string
也可以类似uri的方式 _search?q=
|
|
match_phrase
match 是分词查询
match_phrase 是全文本匹配
match_phrase_prefix 是全文匹配,但是最后一个可以部分匹配i like j 能匹
配i like john
multi_match 可以针对多个字段同时匹配某个关键词 看官方例子,subject和
message都需要包含this is a test这些分词
|
|
range query
|
|
summary
最后是文中的总结
| Use case | Query type to use |
|---|---|
| You want to take input from a user, similar to a Google-style interface, and search for documents with the input. | Use a match query or the simple_query_string query if you want to support +/- and search in specific fields. |
| You want to take input as a phrase and search for documents containing that phrase, perhaps with some amount of leniency (slop). | Use a match_phrase query with an amount of slop to find phrases similar to what the user is searching for. |
| You want to search for a single word in a not_analyzed field, knowing exactly how the word should appear. | Use a term query because query terms aren’t analyzed. |
| You want to combine many different searches or types of searches, creating a single search out of them. | Use the bool query to combine any number of subqueries into a single query. |
| You want to search for certain words across many fields in a document. | Use the multi_match query, which behaves similarly to the match query but on multiple fields. |
| You want to return every document from a search. | Use the match_all query to return all documents from a search. |
| You want to search a field for values that are between two specified values. | Use a range query to search within documents with values between a certain range. |
| You want to search a field for values that start with a specified string. | Use a prefix query to search for terms starting with a given string. |
| You want to autocomplete the value of a single word based on what the user has already typed in. | Use a prefix query to send what the user has typed in and get back exact matches starting with the text. |
| You want to search for all documents that have no value for a specified field. | Use the missing filter to filter out documents that are missing fields. |
- 如果你只是想类似搜索引擎一样查询结果,那么用match就好了,也可以用_search?q=或者query:{"query_string":{"query":""}}方式
- 如果你想根据匹配具体的文本或者是全文匹配,那么使用match_phrase
- 如果你想完全匹配分词不包含模糊等,并且字段是not anylazed的情况下, 可以用term
- 如果你想同时用多个查询,可以使用bool
- 如果你相对多个字段进行同一个查询,使用multi_match
- 如果你想返回所有结果 match_all
- 如果你想返回一个具体的时间或者数字间隔的数据使用range
- 如果你想查询以某个字符串开头的使用prefix查询
9 如果你想查询特定字段没有数值的情况下使用missing查询
Chapter5 Anaylzing your data
关于一个数据插入index,需要经历character filter(识别字母), tokenizer(句 子分词), token filter(对分词进行进一步处理,比如lowercase等),index(发 送给lucene存储)
settings or config file
这里我就粘贴一下了哈 具体可以看https://www.elastic.co/guide/en/elasticsearch/reference/6.8/analyzer-anatomy.html
|
|
analyze
如果我们对某一句话想测试下分析的情况,可以用_analyze测试下,新 的_analyze已经有所变化,具体请看https://www.elastic.co/guide/en/elasticsearch/reference/6.8/_testing_analyzers.html
|
|
termvector
正常情况下你可以使用_analyze来测试你的分析情况,有的时候想看下index的 实际的分词情况,这个时候可以使用_termvector,感兴趣可以看看这个里面 https://www.cnblogs.com/huangying2124/p/12854592.html
总结下来关于termvector用法有两种
一种是你定义在index的settings的字段里面,增加类似这种
"term_vector":"with_positions_offsets", 表明记录位置和偏移量,这种叫 index-time
还有一种是和上面的analyze有点像,及时分析,这种叫 query-time
|
|
总结termvector用来分析各个term的统计信息,比如term在index出现的频率(ttf), 位置(position), 有多少个文档包含这个term(doc_freq),term_freq这个在 当前文档出现的频率
多个文档进行统计的时候可以使用 _mtermvectors
|
|
built-in analyzers
standard
combining the standard tokenizer, the standard token filter, the lowercase token filter, and the stop token filter
simple
This analyzer doesn’t work well for Asian languages that don’t separate words with whitespace, though, so use it only for European languages.
whitespace
The whitespace analyzer does nothing but split text into tokens around whitespace—very simple!
stop
The stop analyzer behaves like the simple analyzer but additionally filters out stopwords from the token stream.
keyword
The keyword analyzer takes the entire field and generates a single token on it. Keep in mind that rather than using the keyword tokenizer in your mappings, it’s better to set the index setting to not_analyzed.
pattern
The pattern analyzer allows you to specify a pattern for tokens to be broken apart. But because the pattern would have to be specified regardless, it often makes more sense to use a custom analyzer and combine the existing pattern tokenizer with any needed token filters.
language and multilingual
Elasticsearch supports a wide variety of language-specific analyzers out of the box. There are analyzers for arabic, armenian, basque, brazilian, bulgarian, catalan, chinese, cjk, czech, danish, dutch, english, finnish, french, galician, german, greek, irish, hindi, hungarian, indonesian, italian, norwegian, persian, portuguese, romanian, russian, sorani, spanish, swedish, turkish, and thai. You can specify the language-specific analyzer by using one of those names, but make sure you use the lowercase name! If you want to analyze a language not included in this list, there may be a plugin for it as well.
Snowball
The snowball analyzer uses the standard tokenizer and token filter (like the standard analyzer), with the lowercase token filter and the stop filter; it also stems the text using the snowball stemmer. Don’t worry if you aren’t sure what stemming is; we’ll discuss it in more detail near the end of this chapter.
Tokenization
这里我还是觉得书里面的描述更贴切一点,就贴下书里面的文字。
Standard tokenizer
The standard tokenizer is a grammar-based tokenizer that’s good for most European languages; it also handles segmenting Unicode text but with a default max token length of 255. It also removes punctuation like commas and periods:
|
|
keyword
|
|
letter
The letter tokenizer takes the text and divides it into tokens at things that are not letters. For example, with the sentence “Hi, there.” the tokens would be Hi and there because the comma, space, and period are all nonletters:
|
|
lowercase
|
|
whitespace
|
|
pattern
首先添加一个索引并且设置索引的analyzer
|
|
然后测试这个pattern
|
|
path hierarchy
按照路径树进行生成
|
|
Token filters
Standard
什么也不做
Lowercase
|
|
length filter
定义length filter
|
|
使用length filter,这里注意需要指定tokenizer,否则会报错
|
|
Stop
stop的意思就是忽略这个,也可以配置在一个文件里面
|
|
测试下 a 就没了
|
|
Reverse
顾名思义,反转,每个token都进行反转
|
|
Unique
|
|
Ascii folding
The ascii folding token filter converts Unicode characters that aren’t part of the regular ASCII character set into the ASCII equivalent, if one exists for the character. For example, you can convert the Unicode “ü” into an ASCII “u” as shown here:
|
|
synonym
同义词
先定义同义词 treasure写错了 不好意思
|
|
测试分词
|
|
Ngrams, edge ngrams, and shingles
分词的形式,我们以书中单词举例,分为ngrams, edge ngrams, and shingles, 具体举例子就好明白了。
Ngrams
假设单词是spaghetti 1-grams按照1个字符轮换拆分为s,p,a,g,h,e,t,t,i bigrams拆分为sp, pa, ag, gh, he, et, tt, ti 可以理解为滚轮,2个字符的 滚轮 trigrams拆分为spa, pag, agh, ghe, het, ett, tti
Ngrams的好处可以做模糊匹配或者纠正,当我们输入错误的时候,这个时候对比 score的值就会比较高
Edge ngrams
如果只从开头开始构建,那么就是edge ngrams,同样是单词spaghetti 当min_gram 2 max_gram 6 变成sp, spa, spag, spagh, spaghe
先创建一个edgeNGram filter
|
|
测试
|
|
当然你也可以定义一个完整的analyzer,注意是filter而不是filters哈
|
|
测试下
|
|
Shingles
shingle相当于是基于单词的Ngrams
创建一个shingle filter
|
|
测试下
|
|
Stemming
词干/词根提取,比如administrations在某些算法下,它的词根是administr, 这样你就可以匹配administrator,administration,administrate而不是全部 简单匹配,这样可以让你搜索范围更大而不是全部匹配
Algorithmic stemming
算法式词根,常见的算法 snowball, porter stem, kstem 等。这些算法在于对
词根的宽容性通过aggressive来表示
| stemmer | administrations | administrators | Administrate |
|---|---|---|---|
| snowball | administr | administr | Administer |
| porter_stem | administr | administr | Administer |
| kstem | administration | administrator | Administrate |
可以感觉更不aggressive的是kstem
测试stemming
|
|
Stemming with dictionaries
有时候算法算词根会比较奇怪,对于具体的语言可以用字典来查询对应的词根,
这种过滤器叫做 hunspell
具体比较麻烦我就不演示了。
Prevent stemming
有的时候不想被词根,这个时候在filter链前面增加一个keyword filter,这样 就不会被分词了。也可以看看对应stemming filter是否有相关的override或者 其他相关的参数。
Chapter6 Searching with relevancy
在ES里面,我们根据一个查询可能会有很多的结果,这些结果有一个相关性,es 描述这种相关性的强弱是用score的方式,计算score的方法是TF-IDF,其中TF表 示term frequency,IDF表示inverse document frequency。
term frequency
词频,表示关键词在文本出现的次数 比如Elasticsearch关键词,其中
- We will discuss Elasticsearch 有一个Elasticsearch
- Tuesday the Elasticsearch team will gather to answer questions about
Elasticsearch 有两个Elasticsearch,相关度会更高一点
|
|
公式表示统计你这个分词在文档中出现的数目/所有分词在文档出现数目之和
inverse document frequency
逆向文件频率
- We use Elasticsearch to power the search for our website
- The developers like Elasticsearch so far
- The scoring of documents is calculated by the scoring field
在这里the出现在三个文档里面,所有the的出现不应该影响更高的分数
idf表示如果一个词在各个地方出现得越多,那么它的分数应该降低
公式
|
|
用总文档的数目除以包含该文档的数量,是一个反除数,如果你出现多,分数就 会降低,最后再取一个对数,由于担心除数可能为0,所以分母一般还会+1
至于为什么使用对数,一般是如果词频很高,比如a the这种或者的啥的,这个
时候,TF就会很大,IDF差不多就是 D/文档 数量接近1左右,这个与我们意图不
一致,我们是希望能筛出来这些的,所以加个对数就是接近0了,这样分数会合
理一点,另外一个极端是很少出现的词,这个时候TF很小,但是IDF会很大,差
不多是接近文档的数量,比如只出现1次,这个时候如果文档数量又很多就会明
显增高,如果加个对数以后会小很多。应该也是统计里面很常用的收敛手段,毕
竟自然对数这些更符合描述很多规律性的东西。
最终tfidf=tf*idf
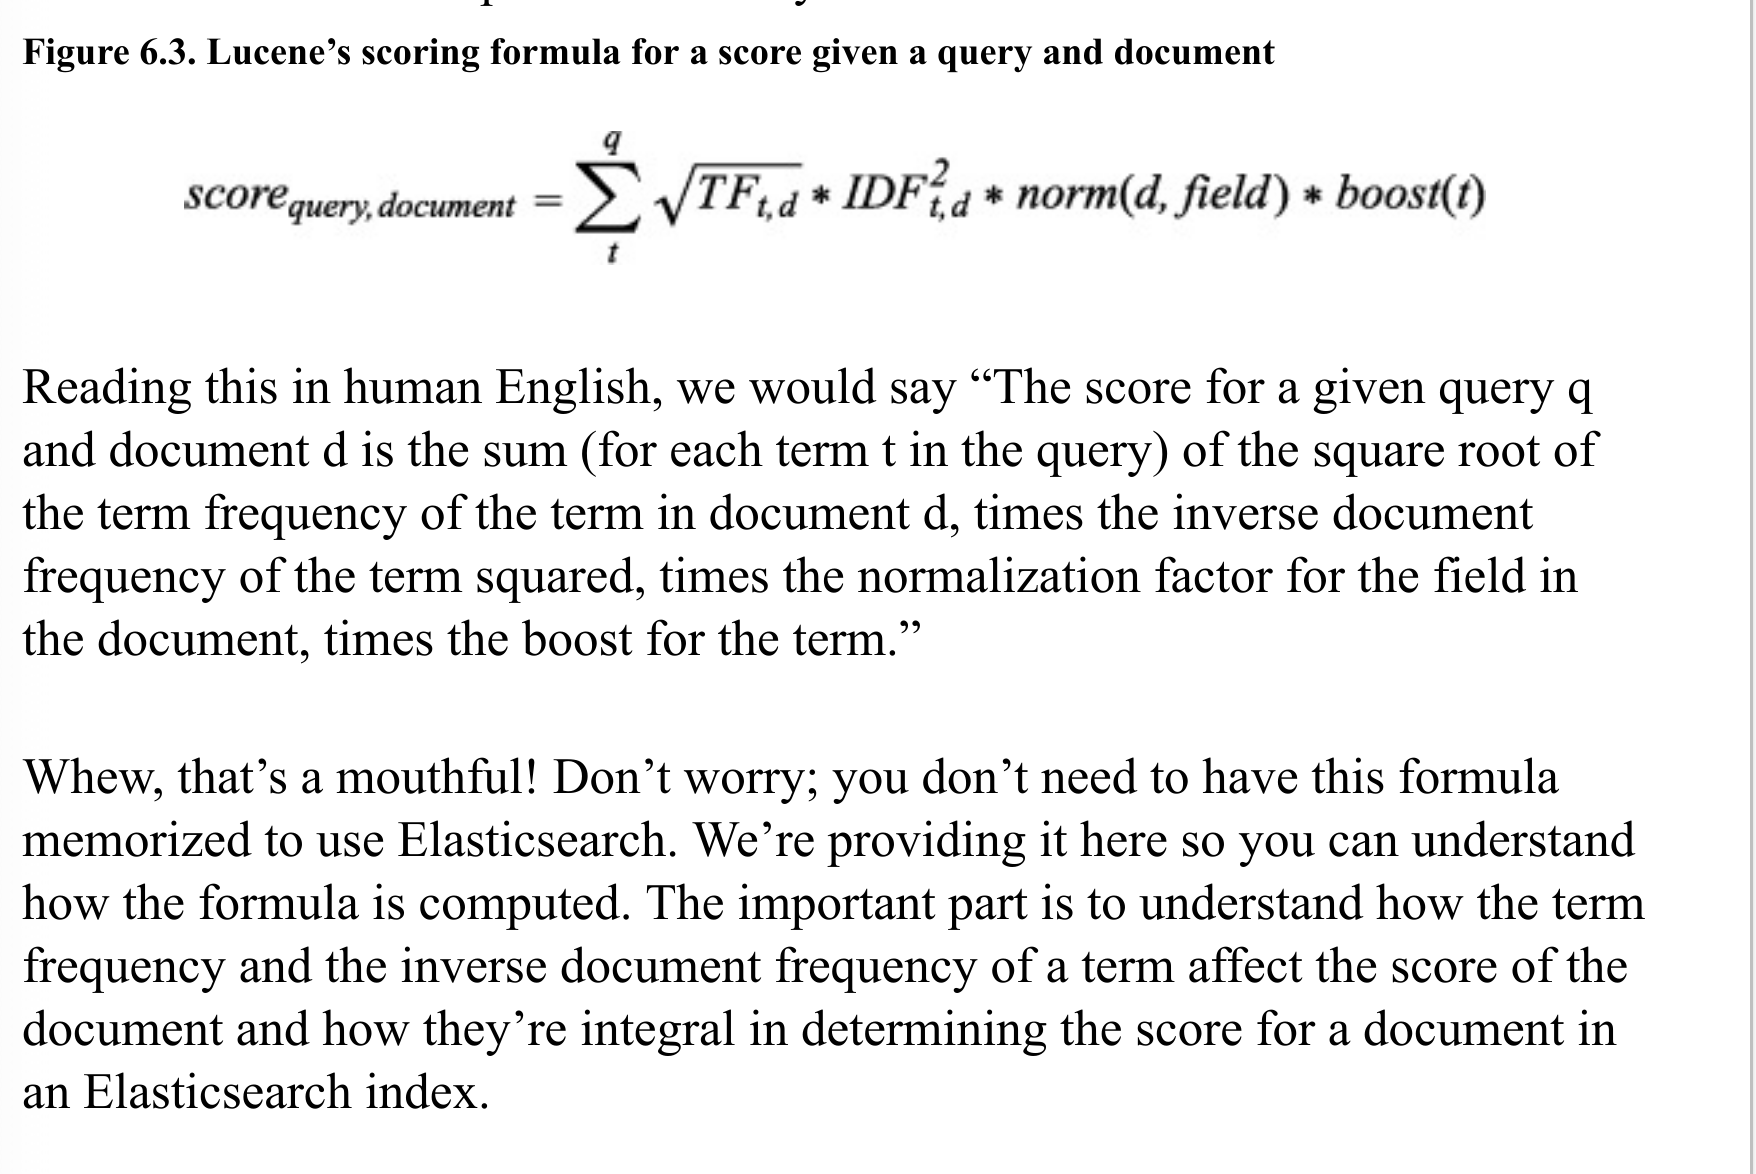
lucene scoring formula
lucence对于score的计算公式
 ◎ ../images/elasticsearch/lucene-score-formula.png
感兴趣的可以继续google下相关内容
TFIDF认为关键词出现概率越大越重要,同时在文档中不能都出现,否则会降低, TFIDF更强调词语的重要性。
other scoring methods
其他的一些算相似度的算法
- Okapi BM25
- Divergence from randomness, or DFR similarity
- Information based, or IB similarity
- LM Dirichlet similarity
- LM Jelinek Mercer similarity
如何修改scoring methods,一个办法是修改索引的mapping,字段的similarity 修改成需要的比如BM25,当然你也可以和filter一样设置自定义的BM25
如果你希望全局修改,可以在elasticsearch里面修改配置,添加 index.similarity.default.type: BM25
关于BM25, 下面是从书里面粘贴的 BM25 has three main settings—k1, b, and discount_overlaps:
k1 and b are numeric settings used to tweak how the scoring is calculated. k1 controls how important term frequency is to the score (how often the term occurs in the document, or TF from earlier in this chapter). b is a number between 0 and 1 that controls what degrees of impact the length of the document has on the score. k1 is set to 1.2 and b is set to 0.75 by default.
Boosting
比如当我们希望在查询的时候title当匹配的时候应该更重要的时候,我们这个 时候可以使用boost,更优雅的对一些情况进行加分。
boost也分为index的时候和query的时候
index的时候,在定义字段的时候设置"boost": 2类似这样就好了,但是一般不 建议这样做,这样的数值后续也无法修改
query的时候,在你的查询里面添加"boost"就好了
|
|
如果不boost
|
|
可以发现boost以后name更重要了
如果是多个字段,可以这样写 ["name^3", "description"]
可以参考
|
|
query string里面也可以指定
|
|
针对分数我们可以进行explain,书里面的方法已经失效了,可以放到命令行里面
|
|
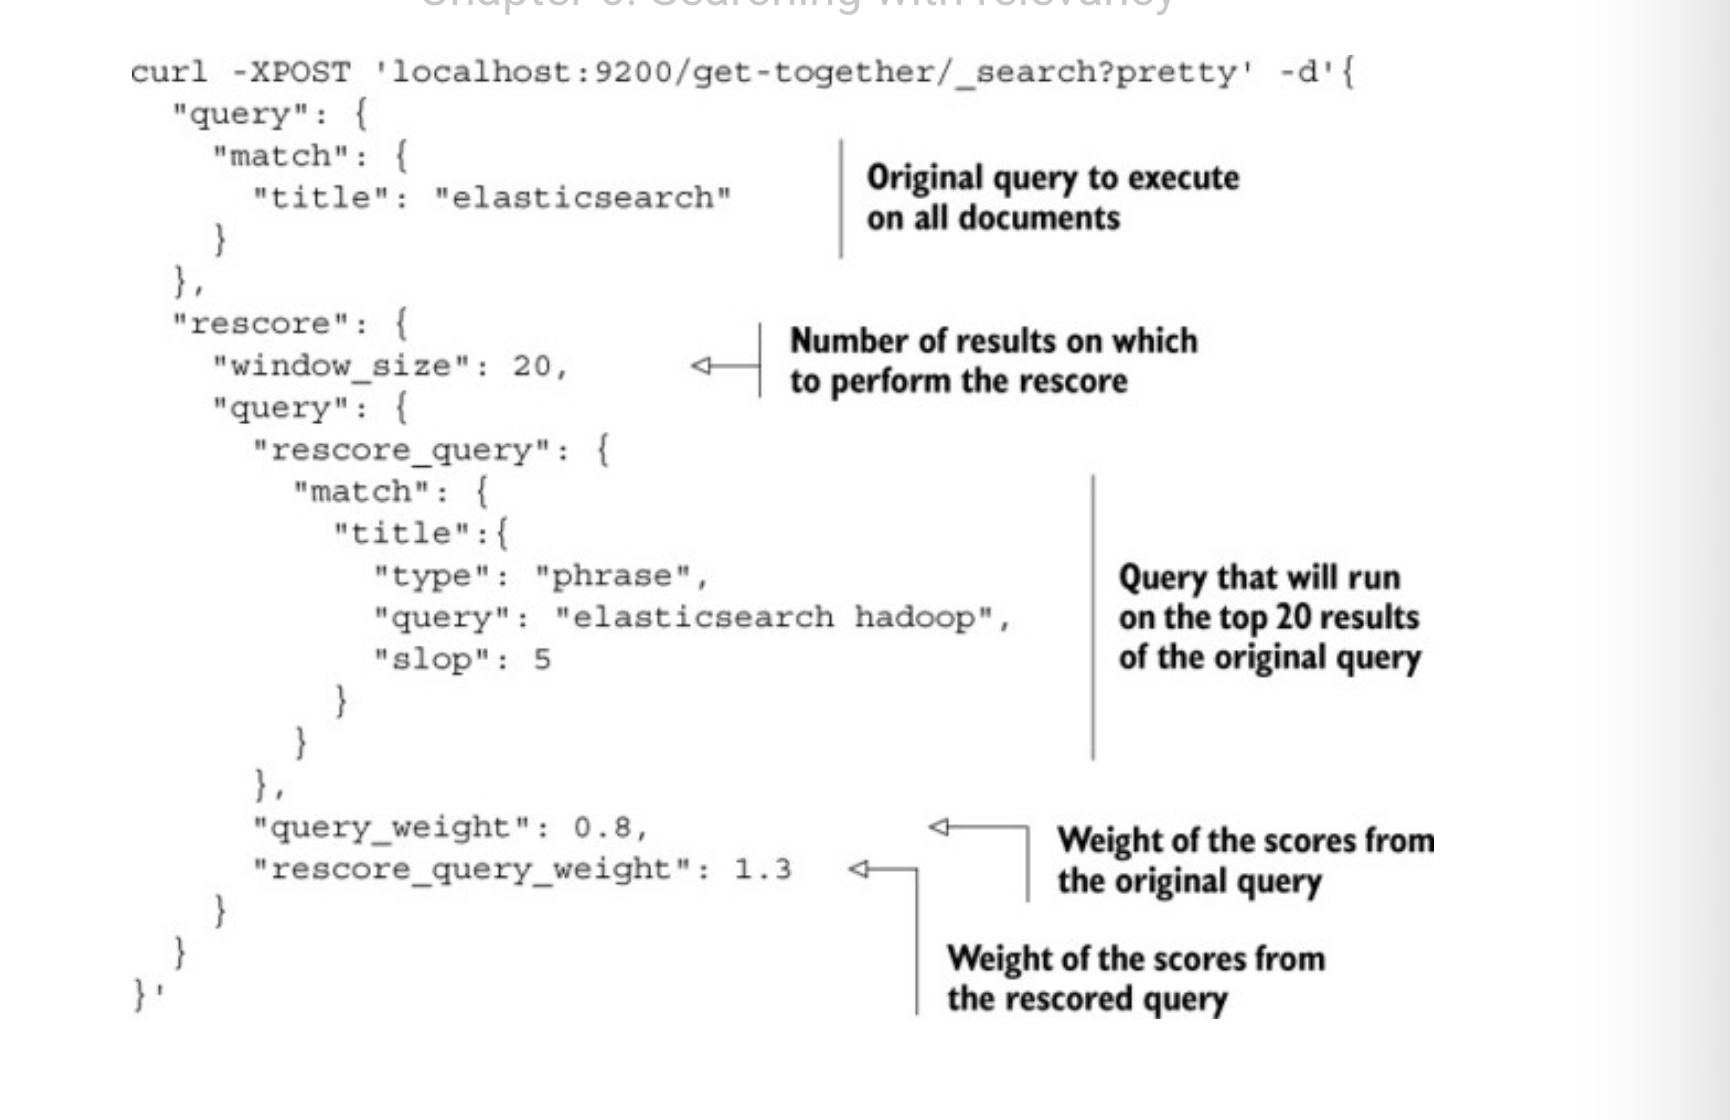
Reducing scoring impact with query rescoring
这个部分主要是说当我们计算score的时候,一般是不太会影响性能的,但是当 我们发现文档数越来越多,自定义脚本函数或者短语匹配等可能影响性能的时候, 这个时候如何去减少这个影响。
elasticsearch里面有一种情况,是你可以顺序不断计算score, 这个方式叫做
rescoring
书里面的例子如下
 ◎ ../images/elasticsearch/rescoring.png
先所有文档过滤前20满足的,再进行rescore查询(里面的查询可能会负载高), 说白了就是进行多次的数据处理而不使用额外手段
function_score
对于score,elasticsearch还支持更高级别的自定义,function_score
weight
|
|
functions里面可以定义列表
field_value_factor
|
|
这里意思就是把某个字段的值能影响score,而之前boost是通过匹配进行影响, 通过ln(VIEWS)进行一定的乘法,具体我也不太清楚咋算的。
script
更多关于script的可以参考这里 https://www.elastic.co/guide/en/elasticsearch/reference/6.8/modules-scripting-using.html
这里就是理解成可以引用变量或者字段,可以进行数学运算,书里面的例子我总 是报错就不复现了
|
|
random
也可以使用随机score
|
|
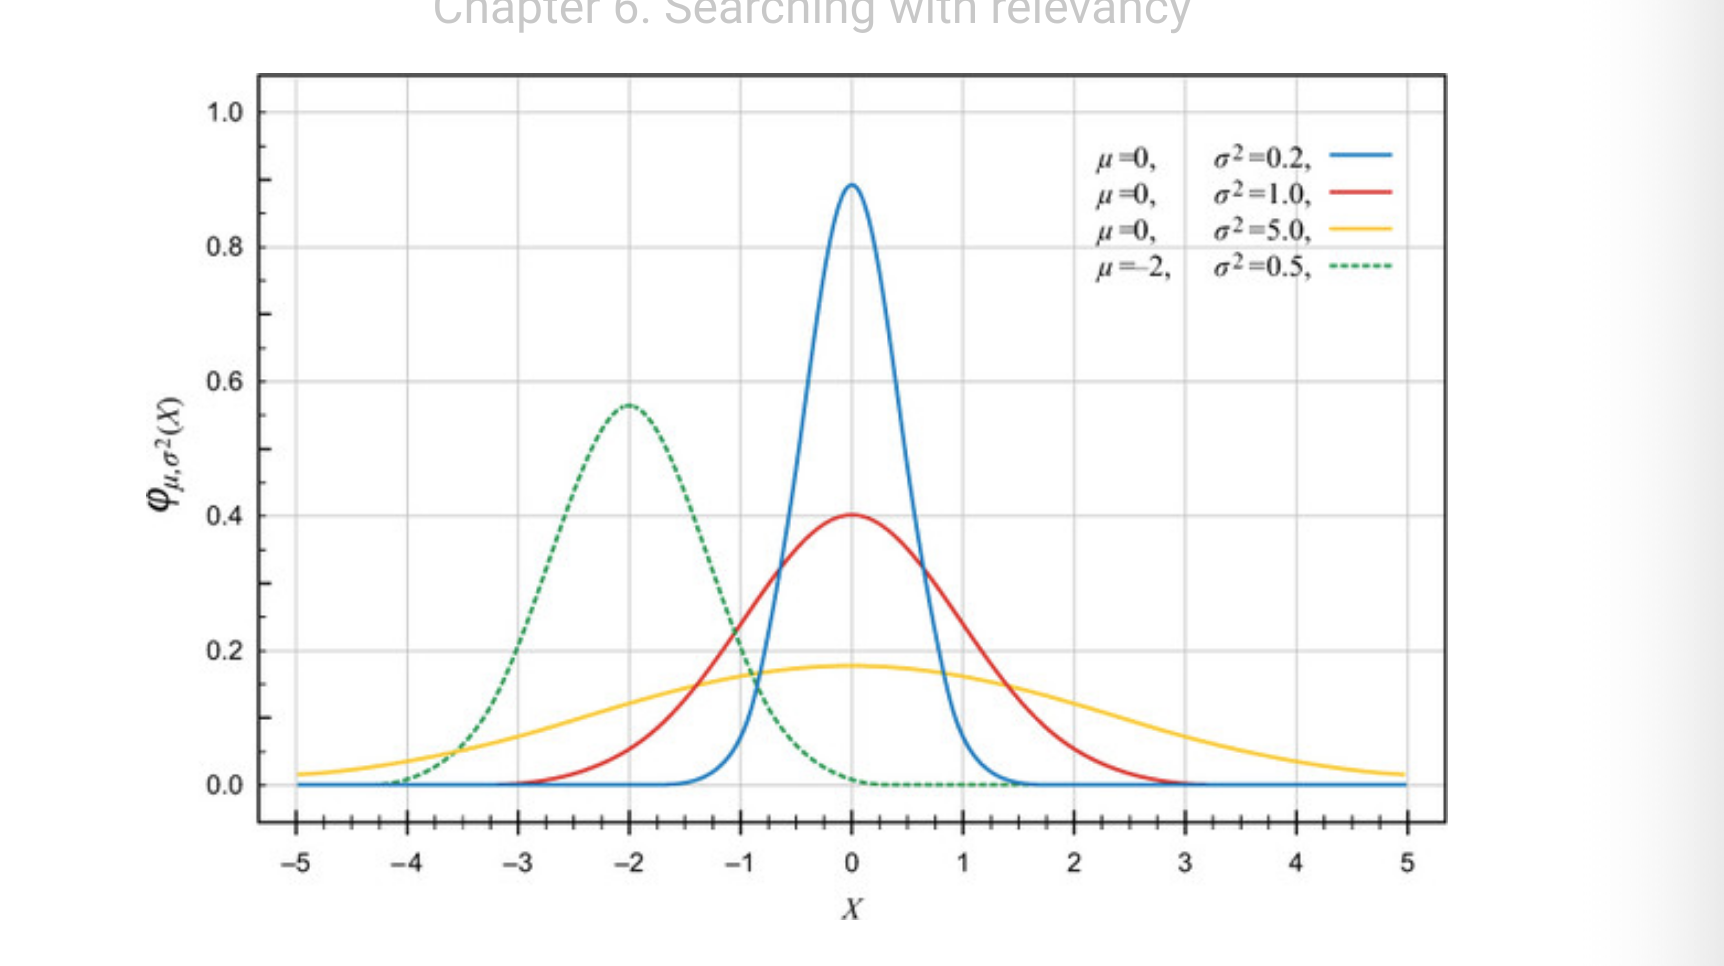
Decay Functions
衰变函数 感兴趣的可以看https://www.elastic.co/guide/en/elasticsearch/reference/6.8/query-dsl-function-score-query.html
意思就是你的score会随着各种衰变函数进行score的变化
 ◎ ../images/elasticsearch/function-score-decay.png
我这里报错了,其实原因就是我导入的时候没有按照人家的mapping,geolocation这个默认自动了,应该设置成type geopoint才可以
意思就是这个地址附近100m的保持不变,如果隔2km则*0.5
|
|
参考文档
- logstash yum安装 https://www.elastic.co/guide/en/logstash/7.13/installing-logstash.html#_yum
- logstash主页 https://www.elastic.co/cn/logstash/
- logstash配置 https://www.elastic.co/guide/en/logstash/current/configuration-file-structure.html
- logstash input https://www.elastic.co/guide/en/logstash/current/input-plugins.html
- logstash output https://www.elastic.co/guide/en/logstash/current/output-plugins.html
- logstash filter https://www.elastic.co/guide/en/logstash/current/filter-plugins.html
- logstash 中文文档 https://www.kancloud.cn/aiyinsi-tan/logstash/849518
- 中文文档