InfluxDB

InfluxDB

InfluxDB

简介

influxdb是一个基于go语言开发的时序数据库,通常用于和时间有关的统计、监控等。 更深入的可以看下知乎这篇文章https://zhuanlan.zhihu.com/p/97247465 官方文档必看https://docs.influxdata.com/influxdb/v1.8/ 官方github https://github.com/influxdata

安装

详情请看https://docs.influxdata.com/influxdb/v1.8/introduction/install/

debian系

1
sudo apt-get install -y influxdb influxdb-client

centos系

1
2
3
4
5
6
7
8
9
cat <<EOF | sudo tee /etc/yum.repos.d/influxdb.repo
[influxdb]
name = InfluxDB Repository - RHEL \$releasever
baseurl = https://repos.influxdata.com/rhel/\$releasever/\$basearch/stable
enabled = 1
gpgcheck = 1
gpgkey = https://repos.influxdata.com/influxdb.key
EOF
yum -y install influxdb

准备工作

整体操作和mysql比较类似,但是大部分情况需要注意下大小写等问题。建议先看下官方的get_started

关键概念

https://docs.influxdata.com/influxdb/v1.8/concepts/key_concepts/ 所有术语 https://docs.influxdata.com/influxdb/v1.8/concepts/glossary/

  • database

数据库,一个可以放保留策略,连续查询和时间序列数据的容器

  • measurement

描述一种数据结构,类似mysql的表

  • point

点,一个点对应一个measurement和对应的数据,和mysql的row类似

  • retention policy(RP)

生存周期策略,保留多少时间内的数据,保留多少份放到集群内 具体rp相关策略可以参考,这里不再赘述 https://docs.influxdata.com/influxdb/v1.8/query_language/manage-database/#retention-policy-management

  • series

一个逻辑的组,这个组包含measurements,tag set and field key

和关系型数据库的对比

https://docs.influxdata.com/influxdb/v1.8/concepts/crosswalk/

  • influxdb时间是一切
  • infuxdb使用influxQL类似sql查询
  • influxdb削弱更新和销毁能力,从而保证最快速的查询和插入,所以是CR-ud not CRUD

使用

influx https://docs.influxdata.com/influxdb/v1.8/tools/shell/ SDK https://docs.influxdata.com/influxdb/v1.8/tools/api_client_libraries/ WEB写入API https://docs.influxdata.com/influxdb/v1.8/guides/write_data/ WEB查询API https://docs.influxdata.com/influxdb/v1.8/guides/query_data/

什么时候使用influxdb

有个很重要的问题,什么时候可以用influxdb,怎么用

  • 基于时间序列的查询或者分析
  • 写多读少
  • 无事务要求

创建数据库

influx方式
1
2
3
4
5
6
7
> create database battle_start_statistics;
> show databases;
name: databases
name
----
_internal
battle_start_statistics
web api方式
 1
 2
 3
 4
 5
 6
 7
 8
 9
10
11
[root@xxx ~]# curl -i -XPOST http://localhost:8086/query --data-urlencode "q=CREATE DATABASE mydb"
HTTP/1.1 200 OK
Content-Type: application/json
Request-Id: 7505ee65-04c0-11ec-8011-52540073b926
X-Influxdb-Build: OSS
X-Influxdb-Version: 1.8.9
X-Request-Id: 7505ee65-04c0-11ec-8011-52540073b926
Date: Tue, 24 Aug 2021 09:48:38 GMT
Transfer-Encoding: chunked

{"results":[{"statement_id":0}]}

查看数据库

influx方式
1
2
3
4
5
6
7
8
[root@xxx ~]# influx
Connected to http://localhost:8086 version 1.8.9
InfluxDB shell version: 1.8.9
> show databases;
name: databases
name
----
_internal
web api方式
 1
 2
 3
 4
 5
 6
 7
 8
 9
10
11
[root@xxx ~]# curl -i -XPOST http://localhost:8086/query --data-urlencode "q=SHOW DATABASES"
HTTP/1.1 200 OK
Content-Type: application/json
Request-Id: 7e322b21-04c0-11ec-8012-52540073b926
X-Influxdb-Build: OSS
X-Influxdb-Version: 1.8.9
X-Request-Id: 7e322b21-04c0-11ec-8012-52540073b926
Date: Tue, 24 Aug 2021 09:48:53 GMT
Transfer-Encoding: chunked

{"results":[{"statement_id":0,"series":[{"name":"databases","columns":["name"],"values":[["_internal"],["battle_start_statistics"],["lqx_test"],["mydb"]]}]}]}

写入数据的方式

influxdb把时间序列作为横坐标,纵坐标是在这个时间点的数据,可以为这个数据添加tag方便查询(tags被索引),保留这些数据结构field的 是measurement,类似于mysql的table。

 1
 2
 3
 4
 5
 6
 7
 8
 9
10
11
12
13
14
15
16
17
18
19
20
21
22
23
24
25
26
27
28
29
30
31
32
33
34
35
36
37
38
39
40
41
42
43
44
45
46
47
48
49
<measurement>[,<tag-key>=<tag-value>...] <field-key>=<field-value>[,<field2-key>=<field2-value>...] [unix-nano-timestamp]
cpu,host=serverA,region=us_west value=0.64
payment,device=mobile,product=Notepad,method=credit billed=33,licenses=3i 1434067467100293230
stock,symbol=AAPL bid=127.46,ask=127.48
temperature,machine=unit42,type=assembly external=25,internal=37 1434067467000000000
#+end_sr
这里可以看下官网的例子
cpu表,host是serverA, 区域是us_west,此时的load为0.64 其中host和region是需要经常查询的tag(index)
payment表,设备是收集,产品是notepad,方法是刷卡,付了33,证书是3i,时间戳是xxx 其中device和product、method是需要经常查询的tag(index)

这里需要注意的是,时间和tag组成唯一标识,如果一样就会覆盖,所以一定要注意设计好tag和field!
*** 写入测试数据
**** influx命令行方式
> create database lqx_test
> use lqx_test
Using database lqx_test
> insert cpu,host=lb0,region=shanghai load1=15,load5=3,load15=2
> show measurements;
name: measurements
name
----
cpu
> select * from cpu;
name: cpu
time                host load1 load15 load5 region
----                ---- ----- ------ ----- ------
1629796895145344606 lb0  15    2      3     shanghai
**** web api方式
这里需要注意一点如果是204表示是成功,这个比较坑哈哈
#+begin_src sh
  [root@xxx ~]# curl -i -XPOST 'http://localhost:8086/write?db=mydb' --data-binary 'cpu,host=nginx01,region=chongqing load1=1,load5=13,load15=22 820287667'
  HTTP/1.1 204 No Content
  Content-Type: application/json
  Request-Id: 81269767-04c1-11ec-8015-52540073b926
  X-Influxdb-Build: OSS
  X-Influxdb-Version: 1.8.9
  X-Request-Id: 81269767-04c1-11ec-8015-52540073b926
  Date: Tue, 24 Aug 2021 09:56:08 GMT
  [root@xxx ~]# curl -i -XPOST http://localhost:8086/query?db=mydb --data-urlencode "q=select * from cpu"
  HTTP/1.1 200 OK
  Content-Type: application/json
  Request-Id: 8a03489a-04c2-11ec-8019-52540073b926
  X-Influxdb-Build: OSS
  X-Influxdb-Version: 1.8.9
  X-Request-Id: 8a03489a-04c2-11ec-8019-52540073b926
  Date: Tue, 24 Aug 2021 10:03:32 GMT
  Transfer-Encoding: chunked

  {"results":[{"statement_id":0,"series":[{"name":"cpu","columns":["time","host","load1","load15","load5","region"],["2021-08-24T09:54:16.756437526Z","nginx01",1,22,13,"chongqing"]}]}]}

删除数据库

influx方式
1
drop database XXX
web api方式
 1
 2
 3
 4
 5
 6
 7
 8
 9
10
11
[root@xxx ~]# curl -i -XPOST http://localhost:8086/query --data-urlencode "q=drop database mydb"
HTTP/1.1 200 OK
Content-Type: application/json
Request-Id: e40fa977-04c2-11ec-801a-52540073b926
X-Influxdb-Build: OSS
X-Influxdb-Version: 1.8.9
X-Request-Id: e40fa977-04c2-11ec-801a-52540073b926
Date: Tue, 24 Aug 2021 10:06:03 GMT
Transfer-Encoding: chunked

{"results":[{"statement_id":0}]}
influx方式
1
drop measurements XXX

查询表

类sql的形式influxQL不再赘述,这里主要说下influxdb独有的flux方式,很有必要看一下哈 这里可以看一下网上介绍的influxdb架构图../images/influxdb-structure.png
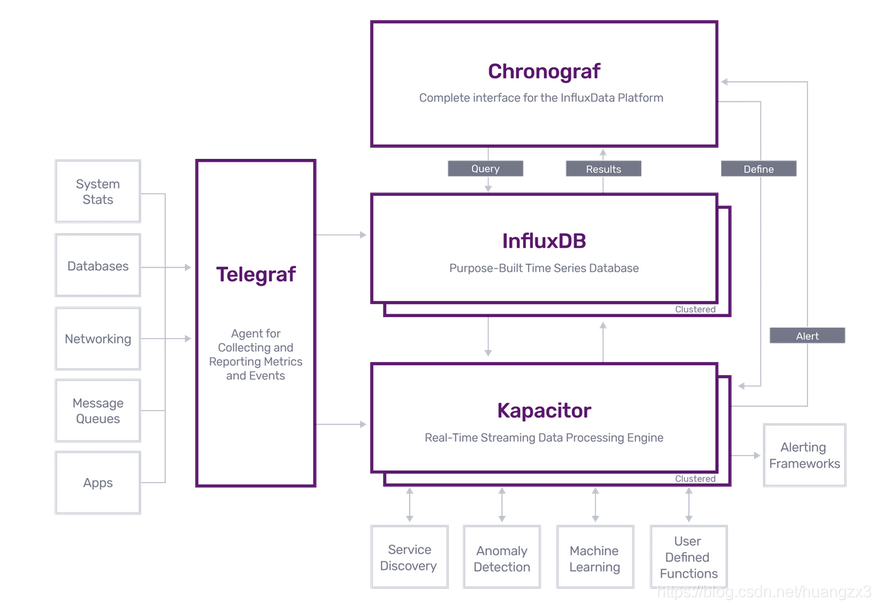
◎ ../images/influxdb-structure.png

flux语法

https://docs.influxdata.com/influxdb/v1.8/flux/ https://docs.influxdata.com/influxdb/v1.8/flux/get-started/ 需要额外注意的是,默认flux是不开启的,需要这样开启https://docs.influxdata.com/influxdb/v1.8/flux/installation/ 开启后是这样的../images/chronograf-influx.jpg
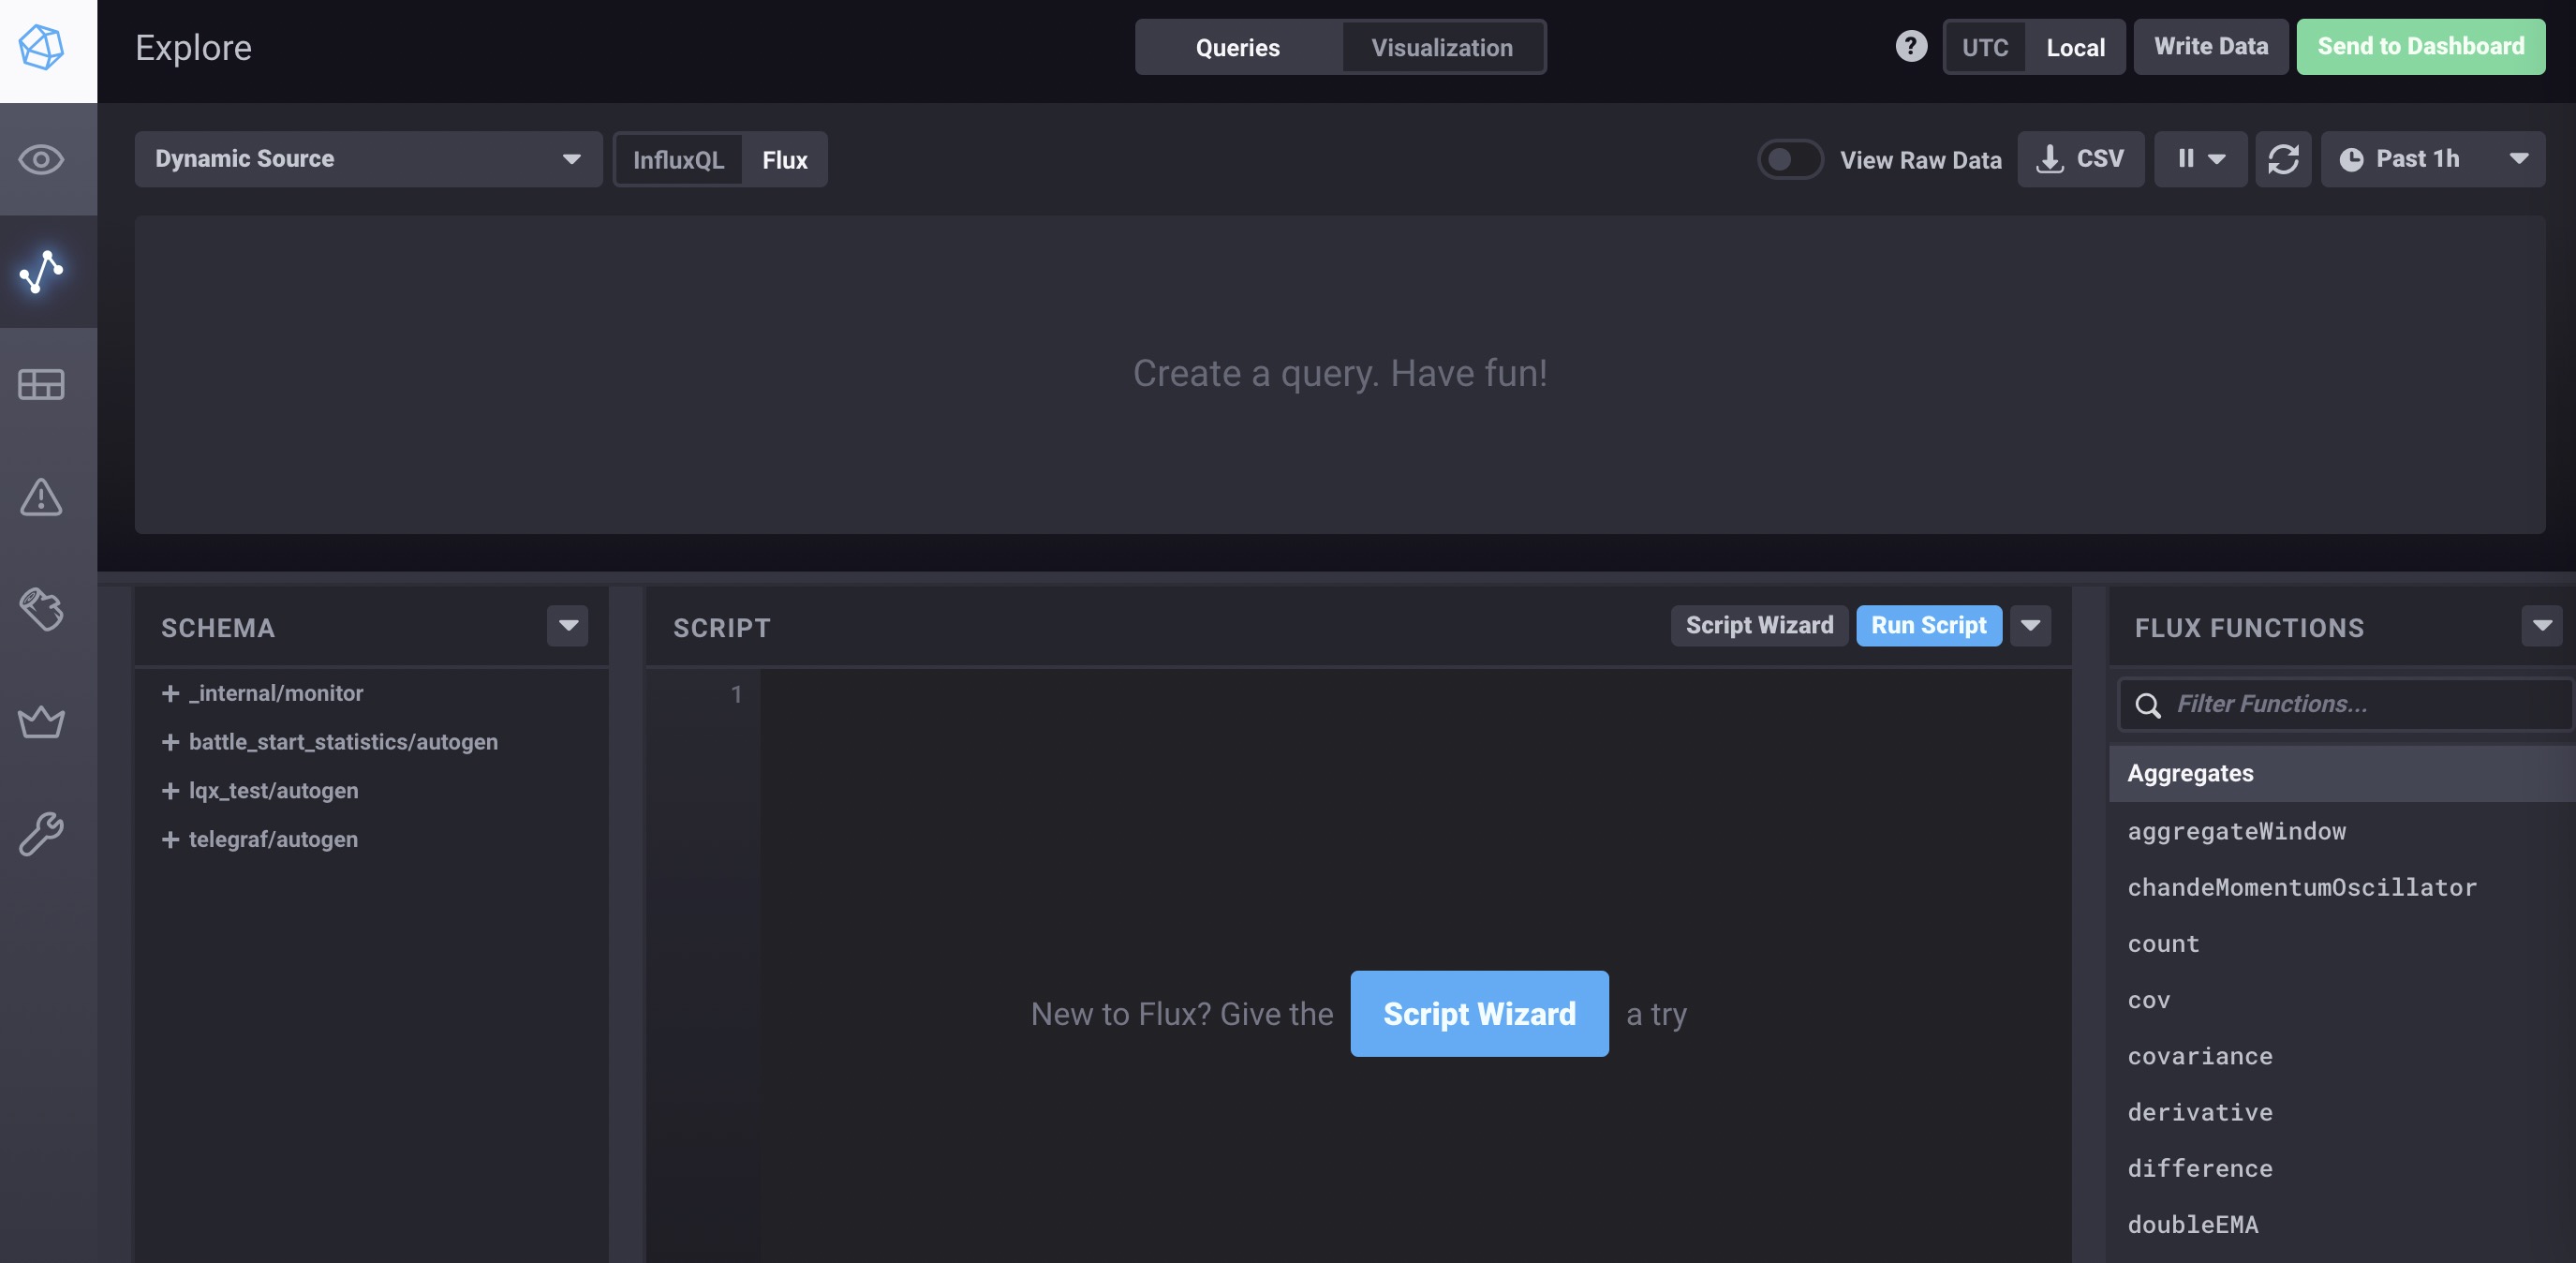
◎ ../images/chronograf-influx.jpg

一些概念concepts
Buckets:

桶,相当于database + retention policy

Pipe-forward operator |>

管道,数据流传递

Tables表
Group Keys分组键

每个分组group的共同值,这个组里面的每一行都是一样的

1
2
# example group key
[_start, _stop, _field, _measurement, host]

_time和_value不是,因为他们不是唯一的,每个row都不同, 具体可以看实际语法实操

install chronograf

https://docs.influxdata.com/chronograf/v1.9/introduction/installation/?t=RedHat+%26amp%3B+CentOS

centos系
1
2
yum -y install chronograf
systemctl start chronograf

这时候一般服务器本身会起8888端口,登录web http://xxx:8888 比较简单一路初始化下,最终可以在explorer页面 http://xxx:8888/sources/1/chronograf/data-explorer ../images/chronograf.jpg◎ ../images/chronograf.jpg 基本看了下,chronograf是一个方便influxdb管理的web平台,类似elk的kibana,有如下功能

  • dashboard 有一个类似grafana的dashboard,可以新建并展示希望看到的数据,当然也可以让grafana展示
  • alert 这个应该是需要kapacitor,支持告警通过编写alert rule,tick script根据influxdb告警,看了一下支持非常多的告警方式(命令,post,mail等等)
  • 用户管理和连接管理 可以创建用户,可以通过8086端口管理多个influxdb
  • 查询 explore功能,可以写influxQL或者flux,实现自己想要的查询
flux语法实操

官方的start文档 https://docs.influxdata.com/influxdb/v1.8/flux/get-started/query-influxdb/ 建议大家到chronograf里面的explore操作 对于flux包含几个部分 在这之前我在liuliancao的库里面插入了3条数据

 1
 2
 3
 4
 5
 6
 7
 8
 9
10
11
12
13
> create database liuliancao
> use liuliancao
Using database liuliancao
> insert cpu,host=lb0,region=shanghai load1=15,load5=3,load15=2
> insert cpu,host=lb1,region=chongqin load1=5,load5=13,load15=12
> insert cpu,host=lb3,region=nanjin load1=50,load5=3,load15=12
> select * from cpu
name: cpu
time                host load1 load15 load5 region
----                ---- ----- ------ ----- ------
1629881706620756455 lb0  15    2      3     shanghai
1629881723493890605 lb1  5     12     13    chongqin
1629881760297182203 lb3  50    12     3     nanjin
指定datasource
1
from(bucket:"liuliancao/autogen")
指定时间范围

紧接着用管道操作符号|>继续跟上时间戳

1
2
from(bucket:"liulaincao/autogen")
|> range(start: -1h, stop: -1m)

run script我们发现是有数据的

指定数据过滤条件

过滤我们的数据,继续跟上我们的管道|>,然后接上filter(), 这个filter里面放一个fn参数,里面是对应的过滤条件函数 这里其实条件可以用and or或者多个条件,注意图形界面可以通过选中字段并add filter实现

1
2
3
4
5
from(bucket: "liuliancao/autogen")
  |> range(start: -1h)
  |> filter(fn: (r) => r._measurement == "cpu")
  |> filter(fn: (r) => r.host == "lb0")
  |> filter(fn: (r) => r._field == "load1" or r._field == "load15")

这个表达式最终获取的就是一条来自liuliancao的cpu measurement的host是lb0的load1的值

group分组
1
2
3
4
5
from(bucket: "liuliancao/autogen")
  |> range(start: -1h)
  |> group(columns: ["region"], mode: "by")
  |> filter(fn: (r) => r._measurement == "cpu")
  |> filter(fn: (r) => r._field == "load1" or r._field == "load15")

对应结果select load1, load15 from cpu group by region;

数值处理

同一个measure相邻字段取差值并根据地区计算整体均值, 用influxQL很简单

 1
 2
 3
 4
 5
 6
 7
 8
 9
10
11
12
13
14
15
16
17
18
> select mean(stage_test) as test_time from (select load5-load15 as stage_test from cpu) group by region;
name: cpu
tags: region=chongqin
time test_time
---- ---------
0    1

name: cpu
tags: region=nanjin
time test_time
---- ---------
0    -9

name: cpu
tags: region=shanghai
time test_time
---- ---------
0    1

用flux怎么写呢, 可以先看这篇不错的influxQL to flux文档 还有官方migration文档

 1
 2
 3
 4
 5
 6
 7
 8
 9
10
11
12
13
14
15
16
17
18
19
20
21
22
23
24
25
26
27
28
29
30
31
32
from(bucket: "liuliancao/autogen")
  |> range(start: -2h)
  |> filter(fn: (r) => r._measurement == "cpu")
  |> pivot(
       rowKey:["_time","host"],
       columnKey: ["_field"],
       valueColumn: "_value"
    )
  |> map(fn: (r)=> ({ r with
    stage_test: r.load5 - r.load15})
  )
  |> keep(columns: ["stage_test","host","region", "_time"])
  |> group(columns: ["region"])
  |> mean(column: "stage_test")


from(bucket: "battle/autogen")
  |> range(start: v.timeRangeStart)
  |> filter(fn: (r) => r._measurement == "battle_start_statistics" and (r._field == "hall_register_end" or r._field == "purchase_start"))
  |> pivot(
       rowKey:["_time"],
       columnKey: ["_field"],
       valueColumn: "_value"
  )
  |> map(fn: (r)=> ({ r with
    usedtime: r.hall_register_end - r.purchase_start})
  )
  |> keep(columns: ["usedtime","ip","public_ip","_time"])
  |> max(column: "usedtime")
  //|> group(columns: ["perflevel"])
  //|> mean(column: "usedtime")

整体用下来目前感觉还是有些时候需要琢磨,比如最简单的算下字段的AS,我认为flux处理的并不好,也可能是我没找到好的答案 如果没有chronograf也没问题,可以通过influx –type=flux进入flux命令行,用起来个人人为比较方便哈,决定更加深入的学习下这个dsl 先从语法开始吧 https://docs.influxdata.com/influxdb/v1.8/flux/get-started/syntax-basics/ 这里继续参考一个官方的例子

1
2
3
timeRange = -1h
cpuUsageUser = from(bucket:"telegraf/autogen") |> range(start: timeRange) |> filter(fn: (r) => r._measurement == "cpu" and r._field == "usage_user" and r.cpu == "cpu-total")
memUsagePercent = from(bucket:"telegraf/autogen") |> range(start: timeRange) |> filter(fn: (r) => r._measurement == "mem" and r._field == "used_percent")

可以看出,flux可以实现类似编程和数据结构相关的方向,这一点是sql不具备的,把一连串数据保存下来,如何使用呢 继续参考官方的例子自己测试下 这里我直接404 page吐了,查看官方的issue发现,是bug,命令需要调整成

1
influx --type=flux -path-prefix /api/v2/query

这样就不会404了 这里我有几个例子,大家可以看看

 1
 2
 3
 4
 5
 6
 7
 8
 9
10
11
12
13
14
15
16
17
18
19
20
21
22
23
24
25
26
27
28
# get results(measurement: cpu, region: shanghai, host: lb0) field: load1
# 这里可以很明显看出,influxdb对tag的数据进行分组了,组成tag keys,如果前面的tag keys保持一组唯一,就是一组数据
> from(bucket:"liuliancao/autogen") |> range(start: -3d) |> filter(fn: (r) => r._measurement == "cpu" and r.region == "shanghai" and r.host == "lb0" and r._field == "load1")
Result: _result
Table: keys: [_start, _stop, _field, _measurement, host, region]
                   _start:time                      _stop:time           _field:string     _measurement:string             host:string           region:string                      _time:time                  _value:float
------------------------------  ------------------------------  ----------------------  ----------------------  ----------------------  ----------------------  ------------------------------  ----------------------------
2021-08-24T03:47:06.533379517Z  2021-08-27T03:47:06.533379517Z                   load1                     cpu                     lb0                shanghai  2021-08-25T09:16:03.860598535Z                            15
2021-08-24T03:47:06.533379517Z  2021-08-27T03:47:06.533379517Z                   load1                     cpu                     lb0                shanghai  2021-08-25T10:32:46.248247999Z                            15

# get results(measurement: cpu, region: shanghai, host: lb0)
> from(bucket:"liuliancao/autogen") |> range(start: -3d) |> filter(fn: (r) => r._measurement == "cpu" and r.region == "shanghai" and r.host == "lb0")
Result: _result
Table: keys: [_start, _stop, _field, _measurement, host, region]
                   _start:time                      _stop:time           _field:string     _measurement:string             host:string           region:string                      _time:time                  _value:float
------------------------------  ------------------------------  ----------------------  ----------------------  ----------------------  ----------------------  ------------------------------  ----------------------------
2021-08-24T03:47:27.501335823Z  2021-08-27T03:47:27.501335823Z                   load1                     cpu                     lb0                shanghai  2021-08-25T09:16:03.860598535Z                            15
2021-08-24T03:47:27.501335823Z  2021-08-27T03:47:27.501335823Z                   load1                     cpu                     lb0                shanghai  2021-08-25T10:32:46.248247999Z                            15
Table: keys: [_start, _stop, _field, _measurement, host, region]
                   _start:time                      _stop:time           _field:string     _measurement:string             host:string           region:string                      _time:time                  _value:float
------------------------------  ------------------------------  ----------------------  ----------------------  ----------------------  ----------------------  ------------------------------  ----------------------------
2021-08-24T03:47:27.501335823Z  2021-08-27T03:47:27.501335823Z                  load15                     cpu                     lb0                shanghai  2021-08-25T09:16:03.860598535Z                             2
2021-08-24T03:47:27.501335823Z  2021-08-27T03:47:27.501335823Z                  load15                     cpu                     lb0                shanghai  2021-08-25T10:32:46.248247999Z                            21
Table: keys: [_start, _stop, _field, _measurement, host, region]
                   _start:time                      _stop:time           _field:string     _measurement:string             host:string           region:string                      _time:time                  _value:float
------------------------------  ------------------------------  ----------------------  ----------------------  ----------------------  ----------------------  ------------------------------  ----------------------------
2021-08-24T03:47:27.501335823Z  2021-08-27T03:47:27.501335823Z                   load5                     cpu                     lb0                shanghai  2021-08-25T09:16:03.860598535Z                             3
2021-08-24T03:47:27.501335823Z  2021-08-27T03:47:27.501335823Z                   load5                     cpu                     lb0                shanghai  2021-08-25T10:32:46.248247999Z                            30
install kapacitor
1
2
yum -y install kapacitor
systemctl start kapacitor
了解kapacitor

官方git https://github.com/influxdata/kapacitor kapacitor is an Open source framework for processing, monitoring, and alerting on time series data. 可以看出kapacitor是做监控数据流处理和告警的。所以对应的是采集器,媒介等信息。 kapacitor使用一种DSL描述语言 TICKscript, 这里看官网的例子,可以看到这样定义结构非常清晰类似flux,我觉得这种解析方式不错,可以用在写的发布系统,哈哈

 1
 2
 3
 4
 5
 6
 7
 8
 9
10
11
12
13
14
15
16
17
18
19
20
21
22
23
24
25
26
27
28
29
30
31
32
33
34
35
36
stream
    |from()
        .measurement('cpu_usage_idle')
        .groupBy('host')
    |window()
        .period(1m)
        .every(1m)
    |mean('value')
    |eval(lambda: 100.0 - "mean")
        .as('used')
    |alert()
        .message('{{ .Level}}: {{ .Name }}/{{ index .Tags "host" }} has high cpu usage: {{ index .Fields "used" }}')
        .warn(lambda: "used" > 70.0)
        .crit(lambda: "used" > 85.0)

        // Send alert to hander of choice.

        // Slack
        .slack()
        .channel('#alerts')

        // VictorOps
        .victorOps()
        .routingKey('team_rocket')

        // PagerDuty
        .pagerDuty()

# Define the task (assumes cpu data is in db 'telegraf')
kapacitor define \
    cpu_alert \
    -type stream \
    -dbrp telegraf.default \
    -tick ./cpu_alert.tick
# Start the task
kapacitor enable cpu_alert
install telegraf
centos系
1
2
yum -y install telegraf
systemctl start kapacitor

装完telegraf,在一开始配置chronograf的时候你可能默认选择了一些dashboard,没有页不影响

高可用

influx-proxy

 1
 2
 3
 4
 5
 6
 7
 8
 9
10
11
12
13
14
15
16
wget https://ghproxy.com/https://github.com/chengshiwen/influx-proxy/releases/download/v2.5.6/influx-proxy-2.5.6-linux-amd64.zip
cd influx-proxy-2.5.6-linux-amd64
cp  influx-proxy /usr/local/bin/
cat << EOF > /etc/systemd/system/influxdb-proxy.service
[Unit]
Description=influxdb proxy service node
After=network-online.target
[Service]
Type=simple
ExecStart=/usr/local/bin/influx-proxy  -config=/etc/influxdb/proxy-prod.json
Restart=always
RestartSec=30s
[Install]
WantedBy=multi-user.target
EOF
systemctl daemon-reload && systemctl enable influxdb-proxy && systemctl start influxdb-proxy

然后看7076是否起来就ok了 但是这个方案不支持prometheus

influxb-relay

 1
 2
 3
 4
 5
 6
 7
 8
 9
10
11
12
13
14
15
16
17
18
19
20
21
22
23
24
25
26
27
28
29
30
31
32
33
34
35
36
echo export GOPROXY="https://goproxy.cn" >> ~/.bashrc
source ~/.bashrc
yum -y install golang
go get -u
sudo cp -r ~/go/bin/influxdb-relay /usr/local/bin/
sudo chmod u+x /usr/local/bin/influxdb-relay
cat <<EOF > /etc/influxdb/influxdb-relay.toml
[[http]]
name = "example-http"
bind-addr = "127.0.0.1:9096"
output = [
    { name="local1", location = "http://localhost:8086/write" },
    { name="local2", location = "http://172.16.27.85:7086/write" },
]

#[[udp]]
#name = "example-udp"
#bind-addr = "127.0.0.1:9096"
#read-buffer = 0 # default
#output = [
#    { name="local1", location="127.0.0.1:8089", mtu=512 },
#    { name="local2", location="127.0.0.1:7089", mtu=1024 },
#]
EOF
cat << EOF > /etc/systemd/system/influxdb-relay.service
[Unit]
Description=influxdb relay service node
After=network-online.target
[Service]
Type=simple
ExecStart=/usr/local/bin/influxdb-relay  -config  /etc/influxdb/relay.toml
Restart=always
RestartSec=30s
[Install]
WantedBy=multi-user.target
EOF

这样就可以实现一个简单的集群了,目前也不支持prometheus,有一个作者实现了这个,感兴趣可以尝试下

prometheus的折衷办法

写两份,读两份

1
2
3
4
5
6
remote_write:
  - url: "http://localhost:8086/api/v1/prom/write?db=proms1"
  - url: "http://172.16.27.85:8086/api/v1/prom/write?db=proms1"
remote_read:
  - url: "http://localhost:8086/api/v1/prom/read?db=proms1"
  - url: "http://172.16.27.85:8086/api/v1/prom/read?db=proms1"